2. Smarter search
2.1 Search
Searches can be performed in the search bar on the homepage, or in the search bar on the header from anywhere on the website. Type search terms into search bars as individual words, or as multiple words contained within quotation marks to create search phrases.
ScholarMagic will return articles that contain any of the search terms, but will favour articles containing more of the terms. Search also considers the length of search terms, their position relative to one another, and their place within the document.
Specify the subject or subjects of your search by clicking the "in all subjects" button on the homepage search bar, or within the Filter tab in the sidebar. This helps target your search and improves results.
By default, all fields (title, author, journal, etc) are searched to find matching articles. If you want to search specific fields, use the Advanced search page or the Filter tab in the sidebar. Settings in Filter or "in all subjects" apply to every search you do on the website, including Auto Search, until they are removed or you start a new session.
2.2 Score Controls
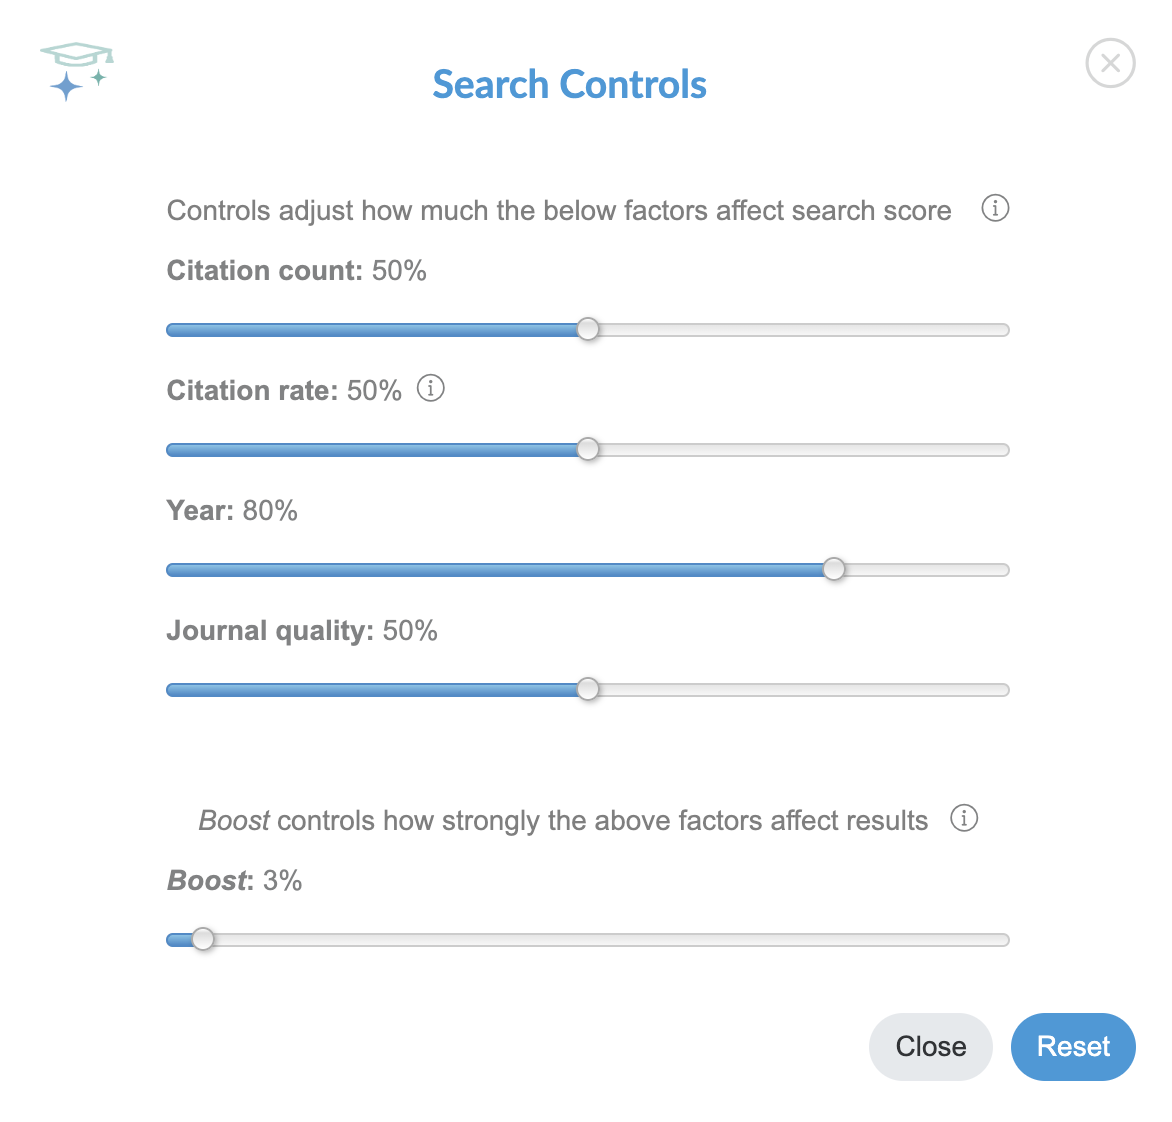
Score Controls let you specify the type of articles you prefer, and determine how search results are ranked.
For example, if you prefer recent articles in high impact journals, crank up the Year and Journal quality sliders. This will boost the Score given to articles with those properties, increasing their ranking within your search results.
The Citation rate metric in Search Controls is the rate at which an article is cited through time, standardized between 0 and 100. Articles published longer ago will naturally have more citations due to the time required for citations to accumulate, so are unfairly favored by Citation Count. Citation rate removes some of this bias, so old and new articles can be compared on a level playing field.
2.3 Visualizations
Instead of viewing search results as a list, you can explore them graphically with our interactive visualizations.
Above the list of results are links to Scatter, Network, Subjects and WordCloud, which show your search results as interactive charts. Charts give you a rapid overview of the field before letting you drilling down for more detailed information.

We suggest adding articles to your Shortlist as you browse the charts. To do this, click on a point to bring up the detailed article panel, then click the icon in the row of buttons under the article title.
You can control chart properties from options in the sidebar, and click, zoom and drag to interact with the charts in various ways.
2.3.1 Scatter
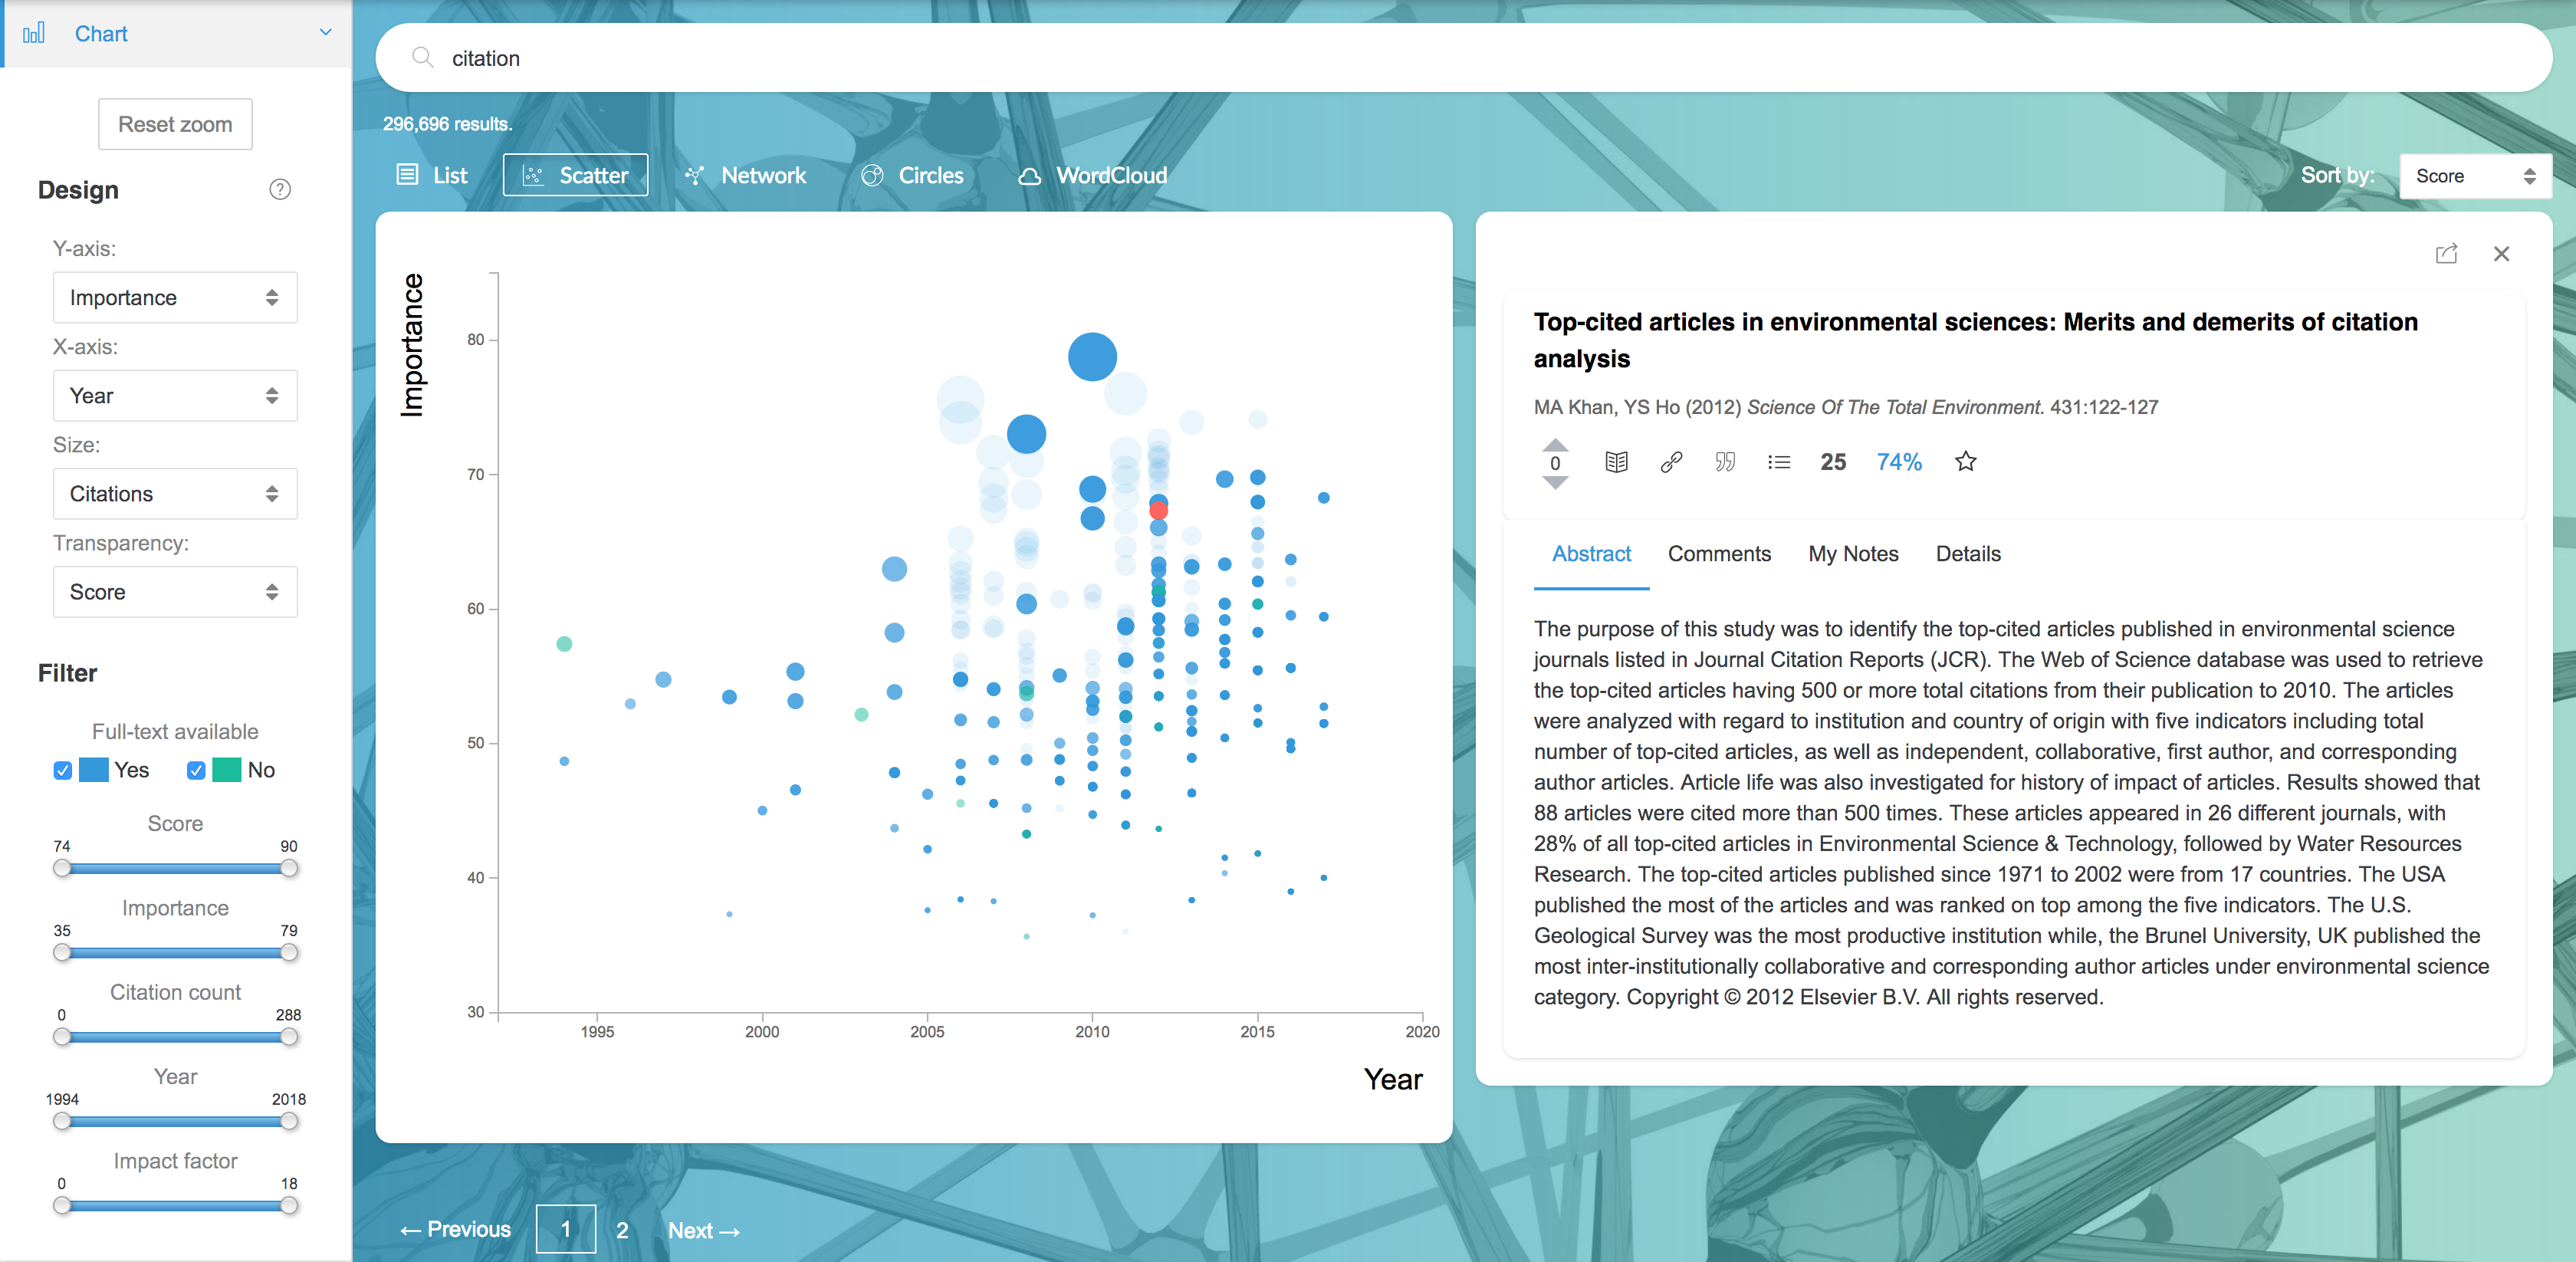
Scatter is an interactive scatter plot that lets you explore articles by their metrics.
Hovering over points will show citation information and the summary. Click points to see more detailed article information, then add them to your Shortlist for later use.
Chart options in the sidebar are:
- Design controls let you specify which variables are plotted on each axis, and which variables are represented by the size and transparency of points.
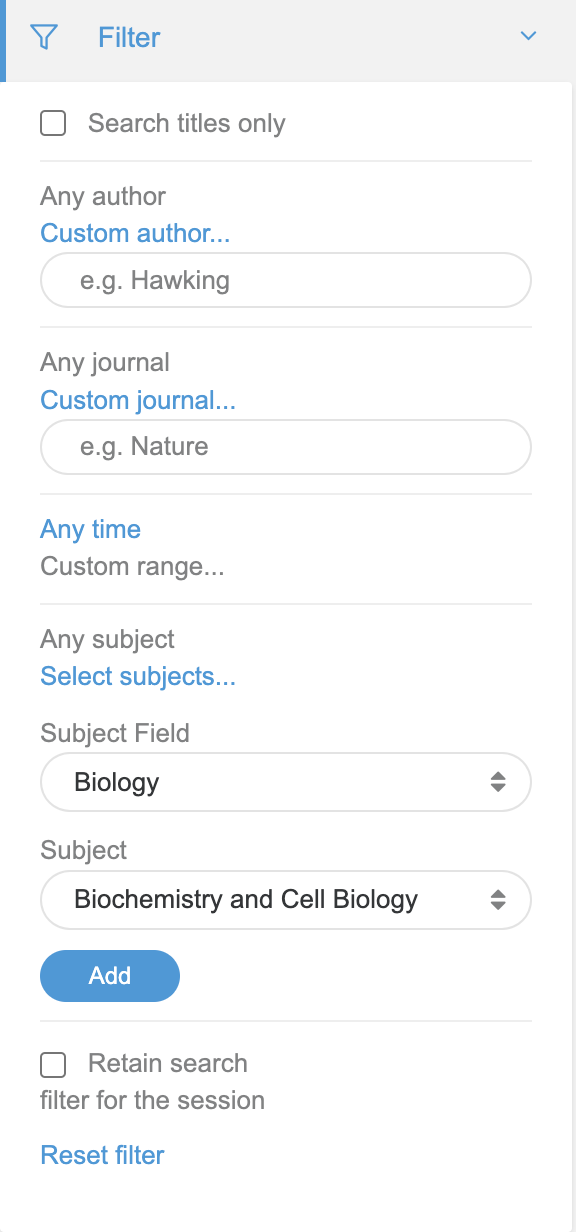
- Filter controls restrict which articles are displayed. You can also filter with additional search criteria using the Filter sidebar tab below the Chart tab.
- Drag (click and drag) and zoom (scroll in and out) to move around the graph.The 'Reset zoom' button re-centers the view and resets the zoom to the initial state.
2.3.2 Network
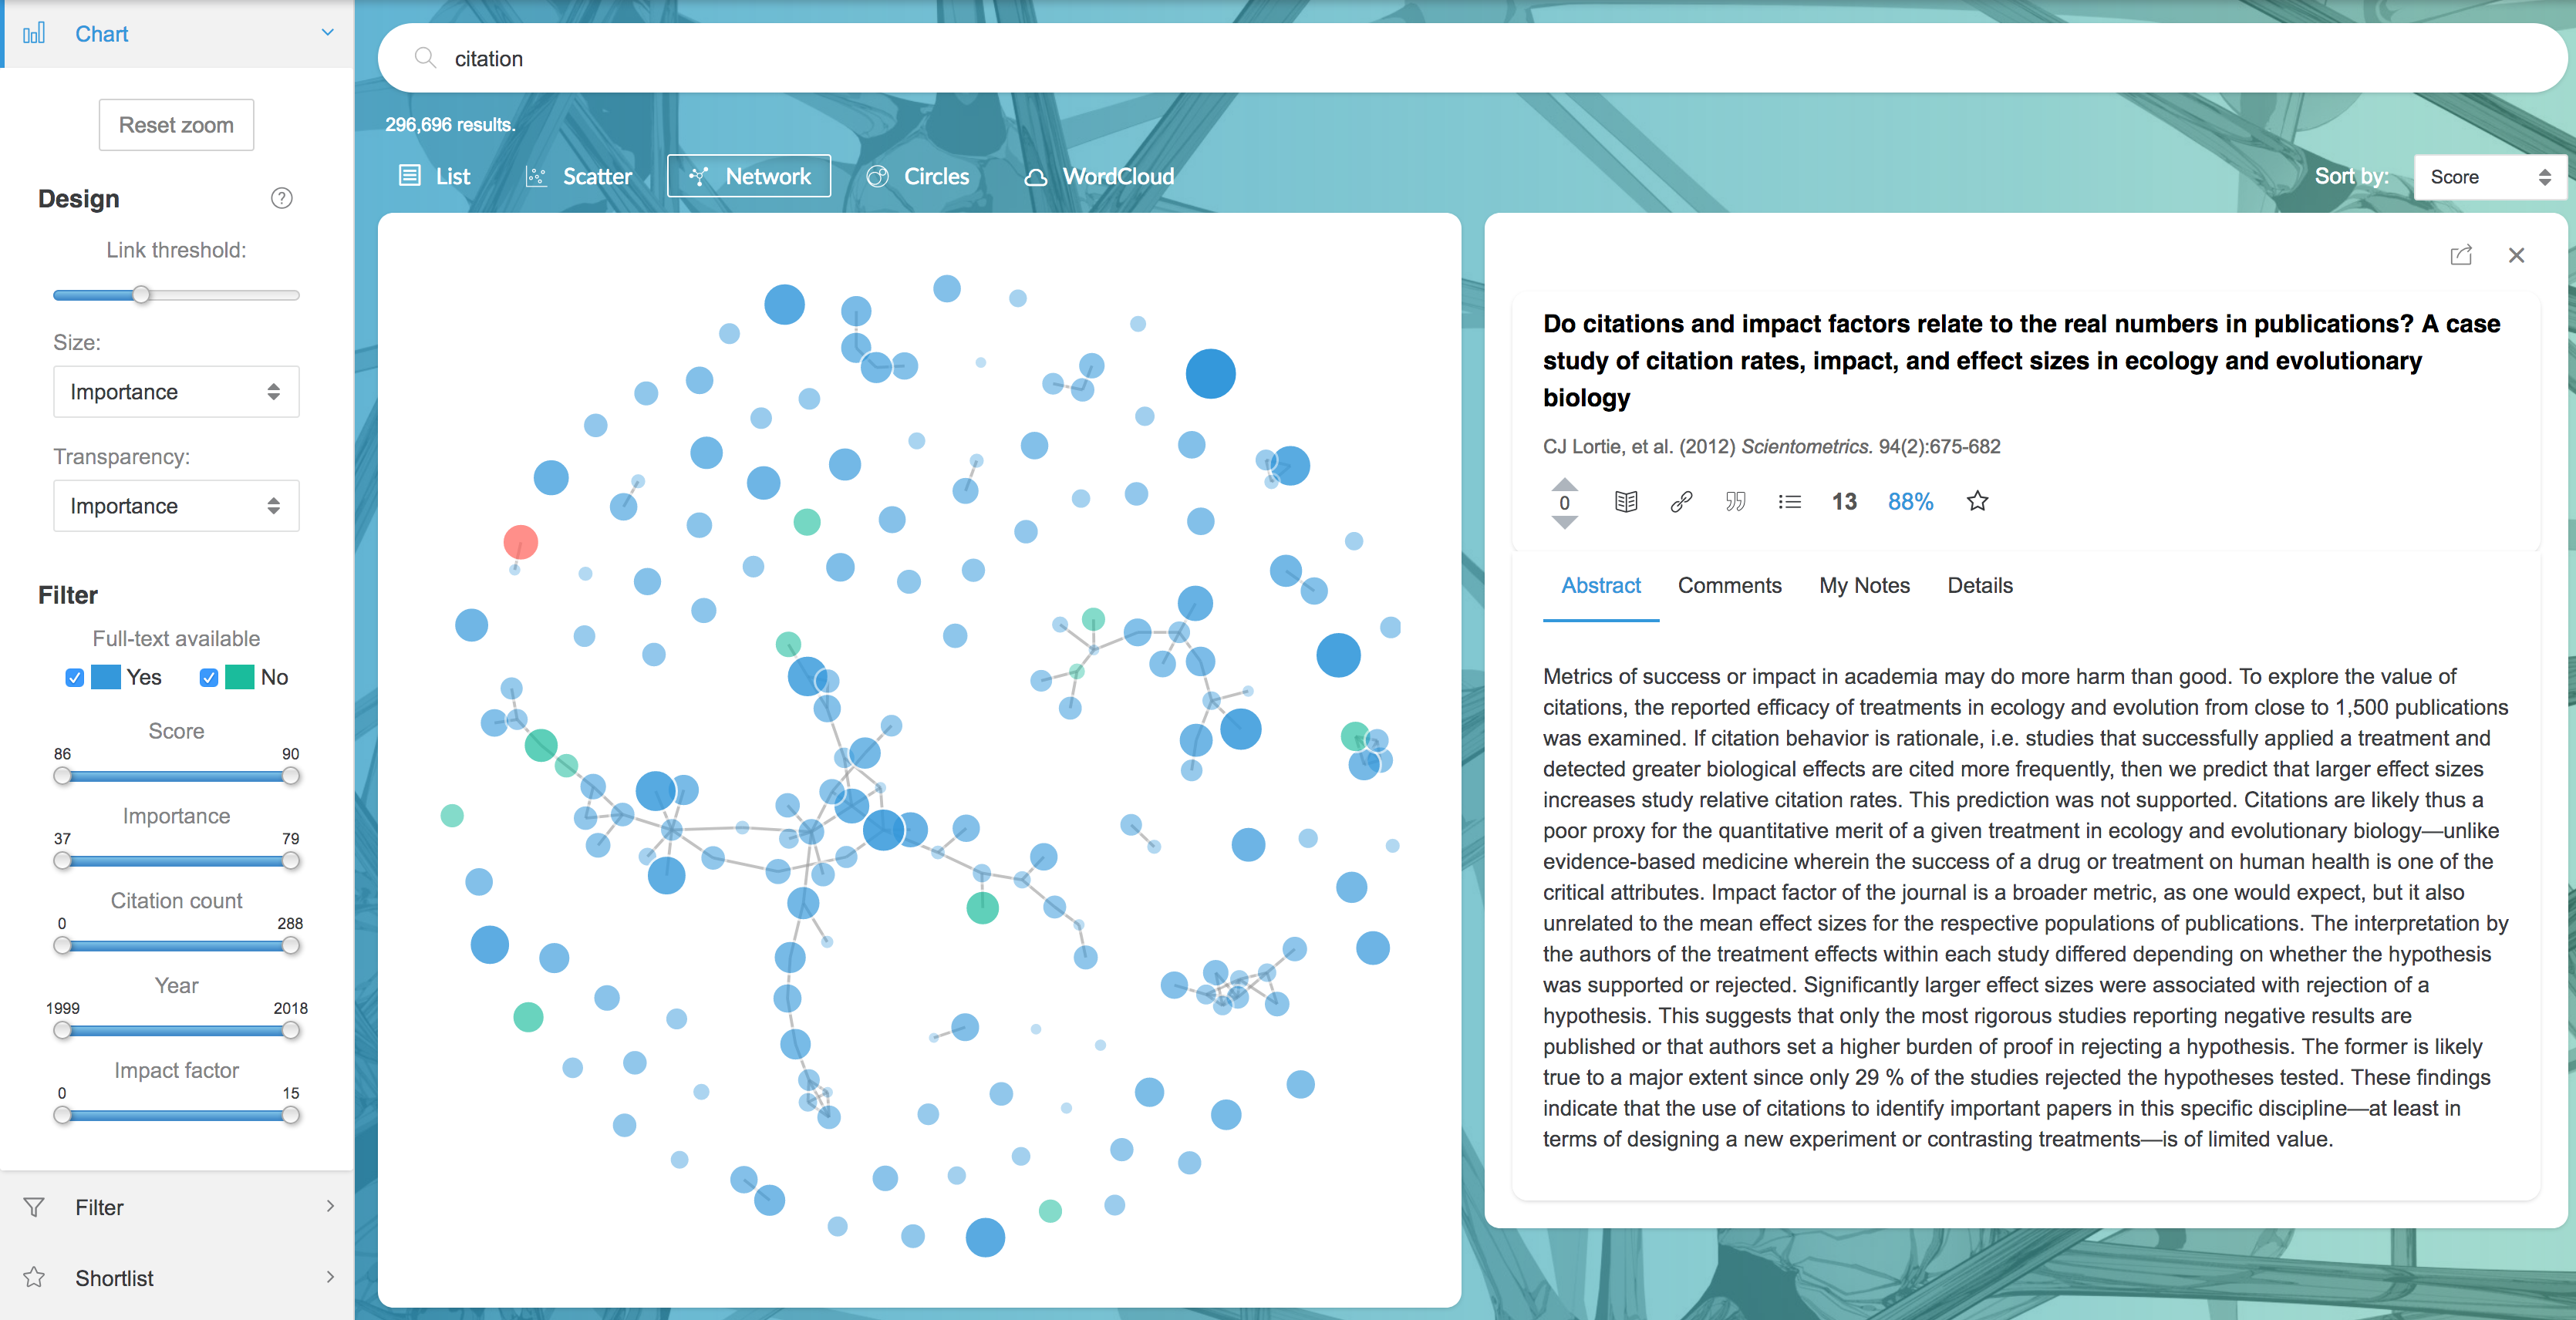
Network links articles based on the similarity of their titles, helping you find groups of similar articles. The shorter the link between two articles, the stronger their similarity.
Hovering over points will show citation information and the summary, and hovering over links shows the word stems that the connected article titles have in common. As with Scatter, click points to drill down to articles, then add them to your Shortlist for later use.
The following options are available in the sidebar:
- The Link threshold slider lets you adjust the minimum similarity needed to create a link. When this is turned up, long links (weaker similarities) are allowed, whereas if it turned down only shorter links (strong similarities) are shown.
- Other Design controls let you change what determines the size and transparency of points.
- Filter restricts which articles are displayed. You can also filter with additional search criteria using the Filter sidebar tab below the Chart tab.
- Drag (click and drag) and zoom (scroll in and out) to move around the graph.The 'Reset zoom' button re-centers the view and resets the zoom to it's initial state.
2.3.3 Subjects
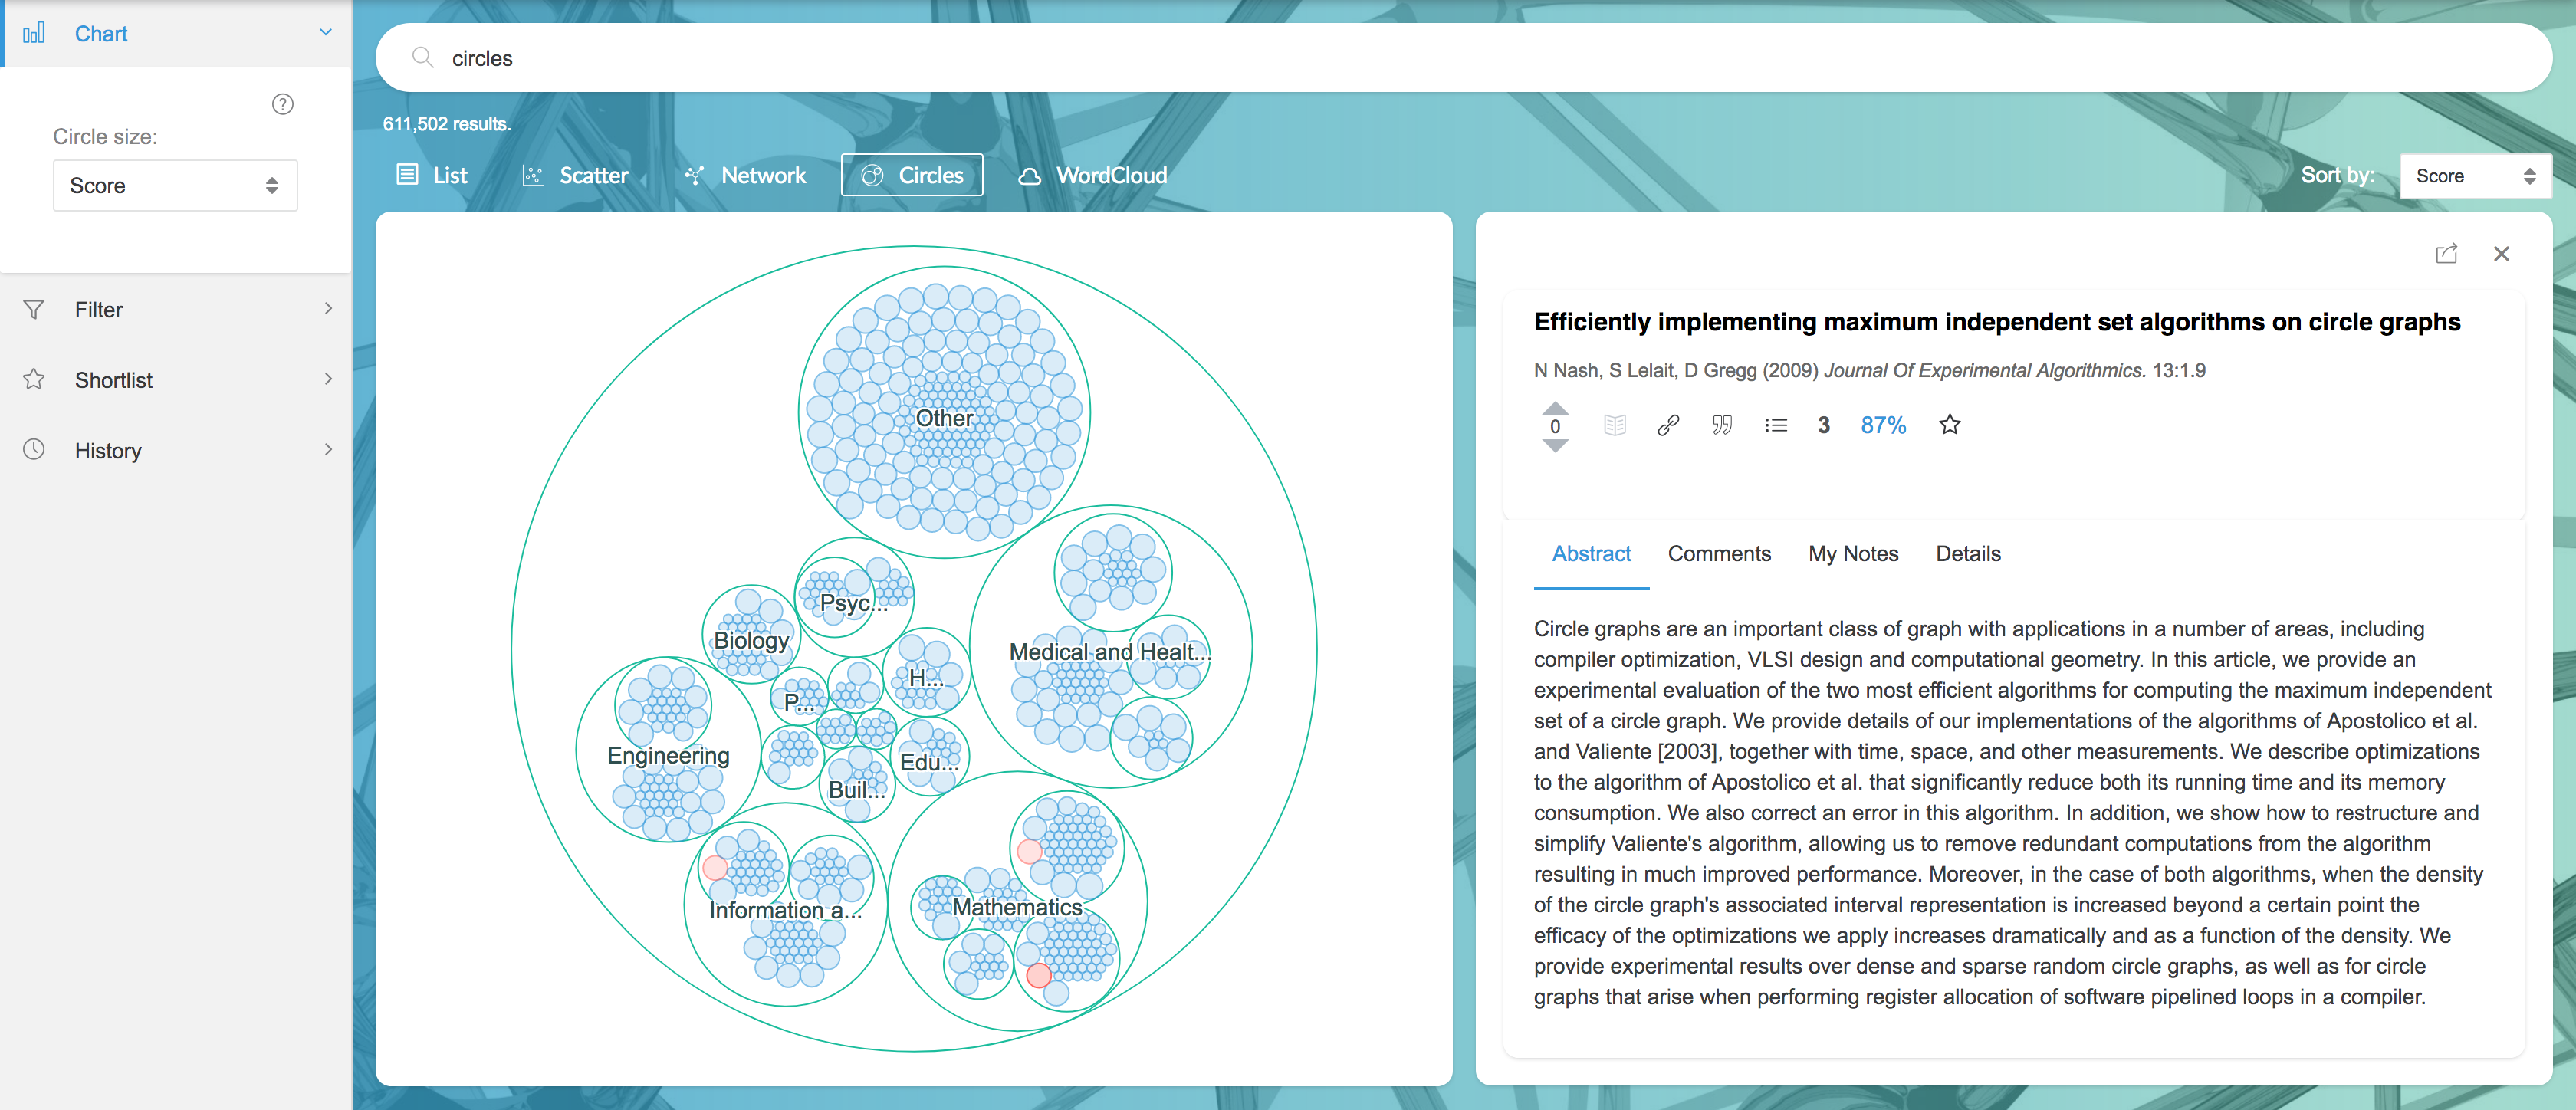
Subjects group articles into their subject categories. Use this to get a sense for how articles are distributed across fields, and instantly narrow search results to the topics you're interested in.
Click within circle groups to zoom into sub-subjects. Circle size represents a property of the articles (e.g. citation count), which you can change in the dropdown menu in the sidebar. Hovering over points will show citation information and the summary. Click points to drill down to articles, then add them to your Shortlist for later use.
2.3.4 WordCloud
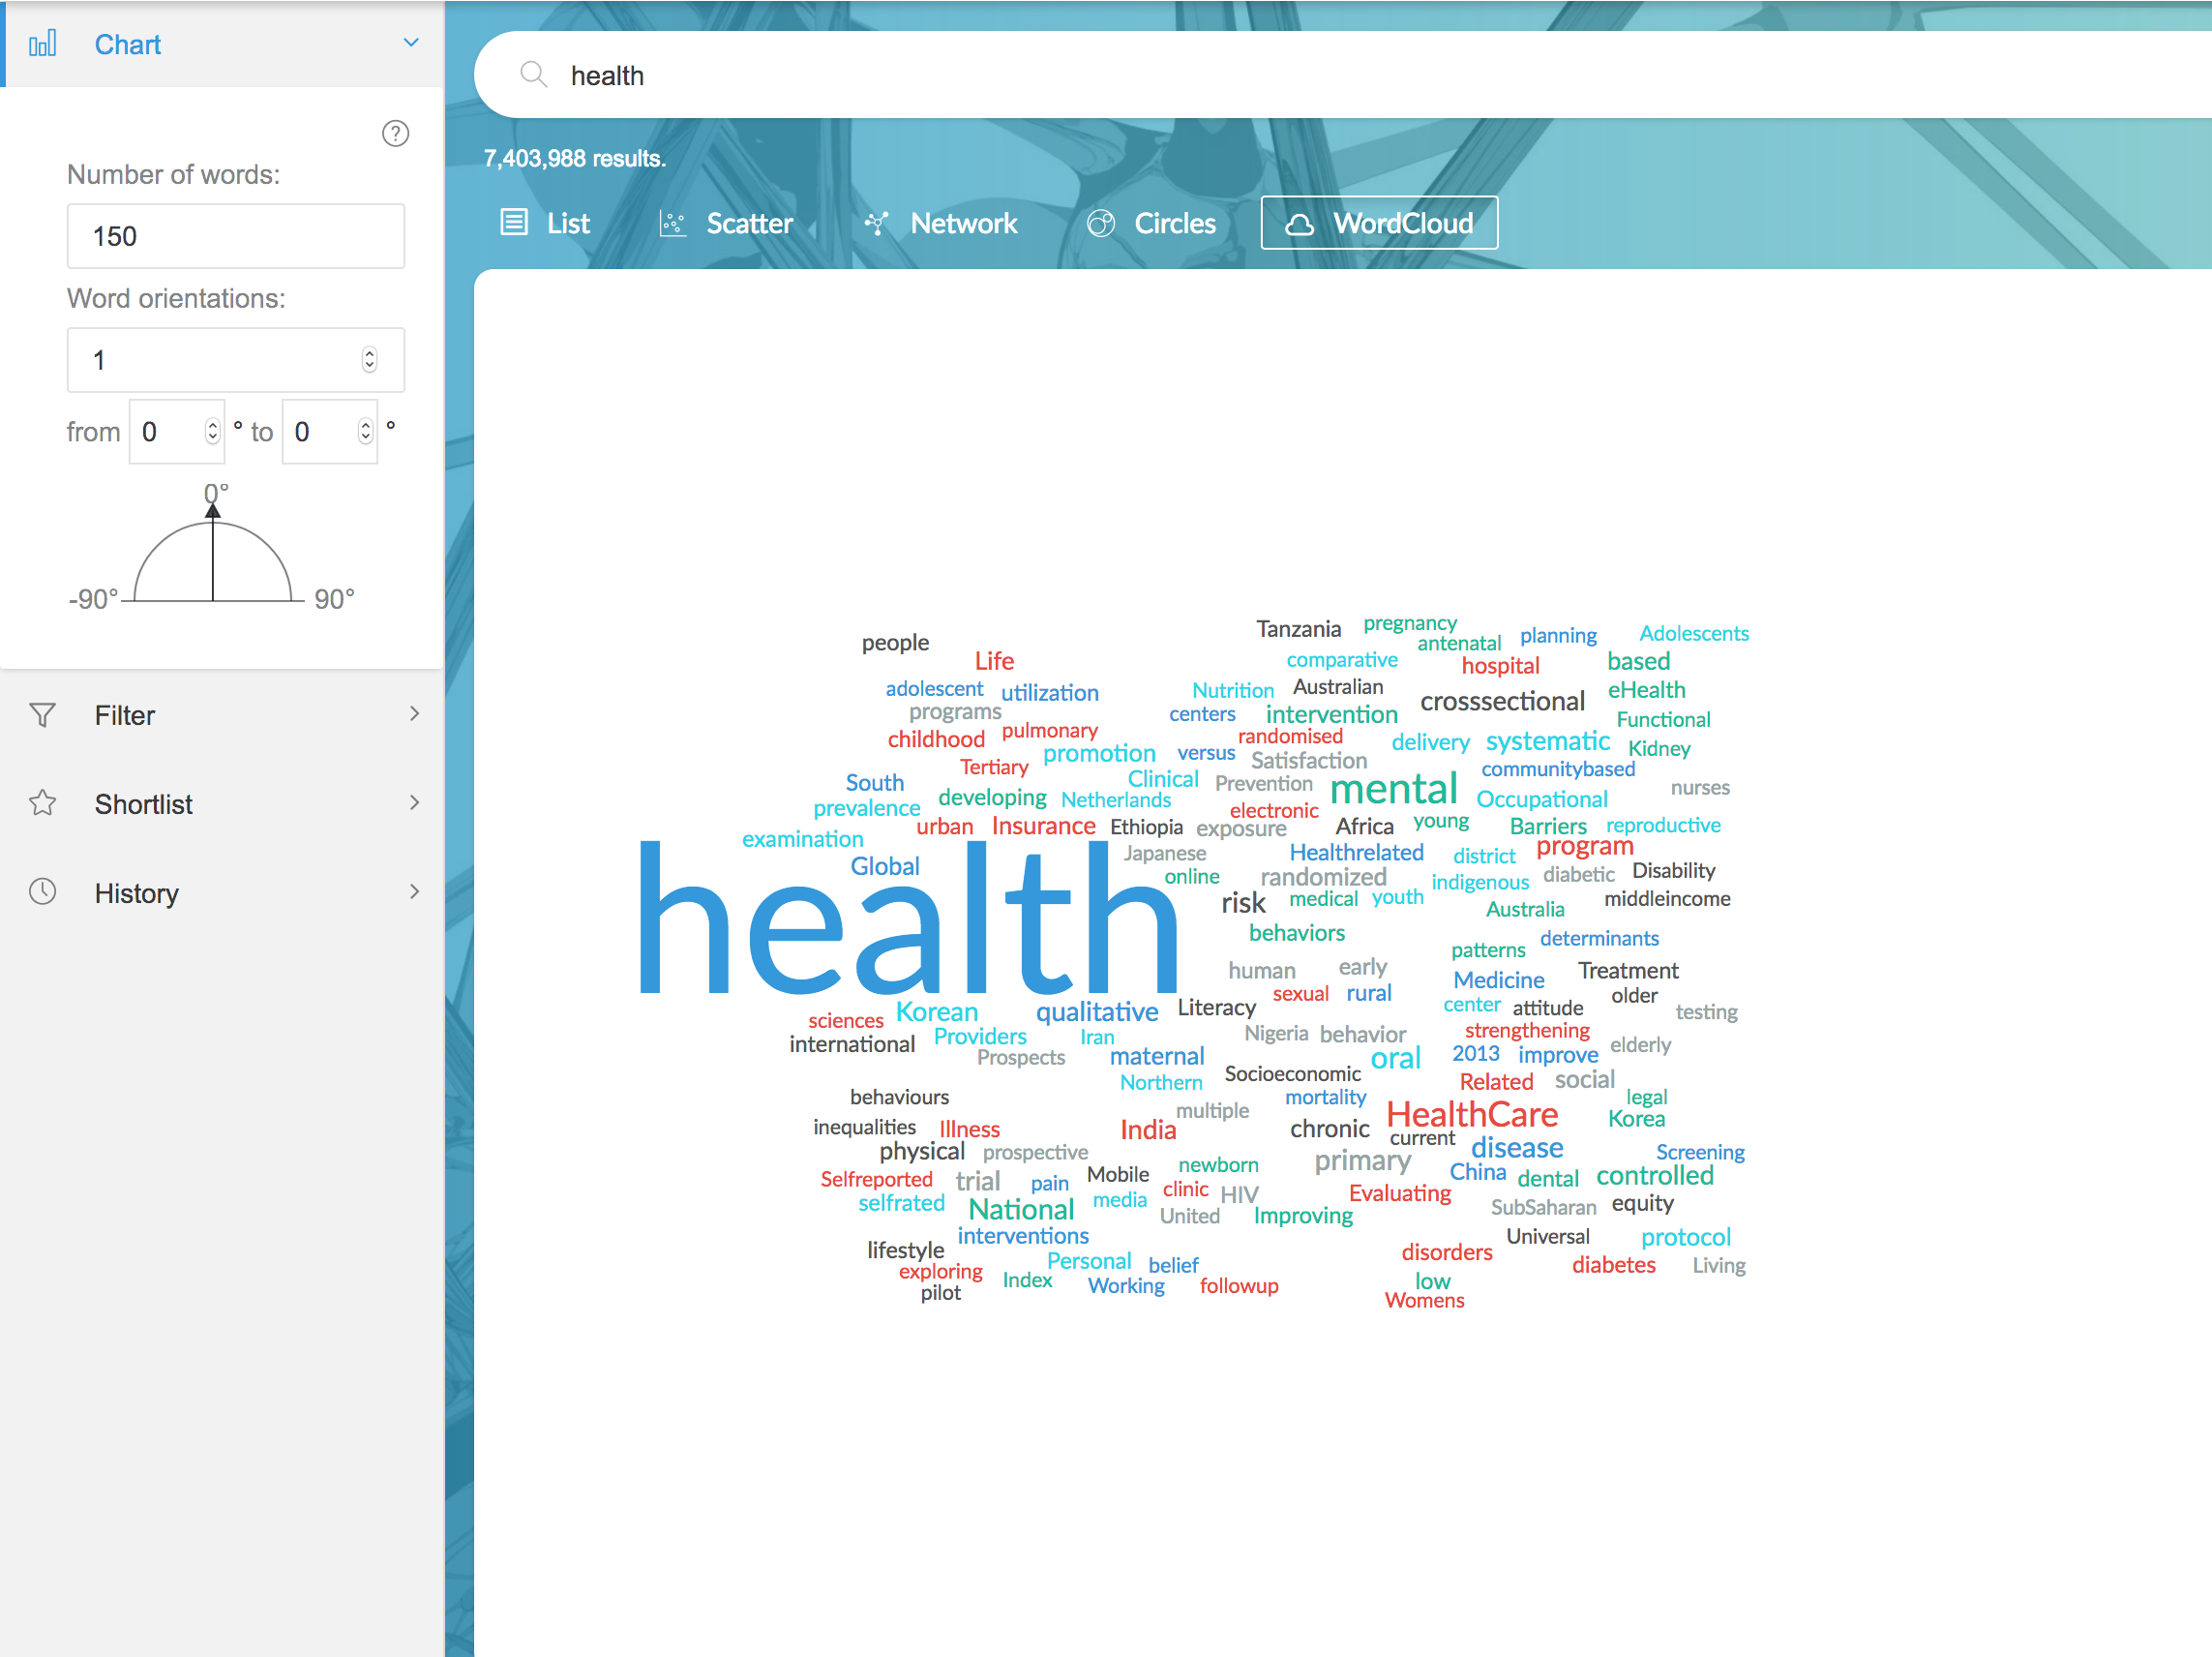
WordCloud creates a word cloud from the titles in your search results, showing the most common words in your search. Use this to see the main areas of research, and to find ideas for additional search terms.
Sidebar options let you change the number of words and appearance of the cloud.
2.4 Advanced search and filter
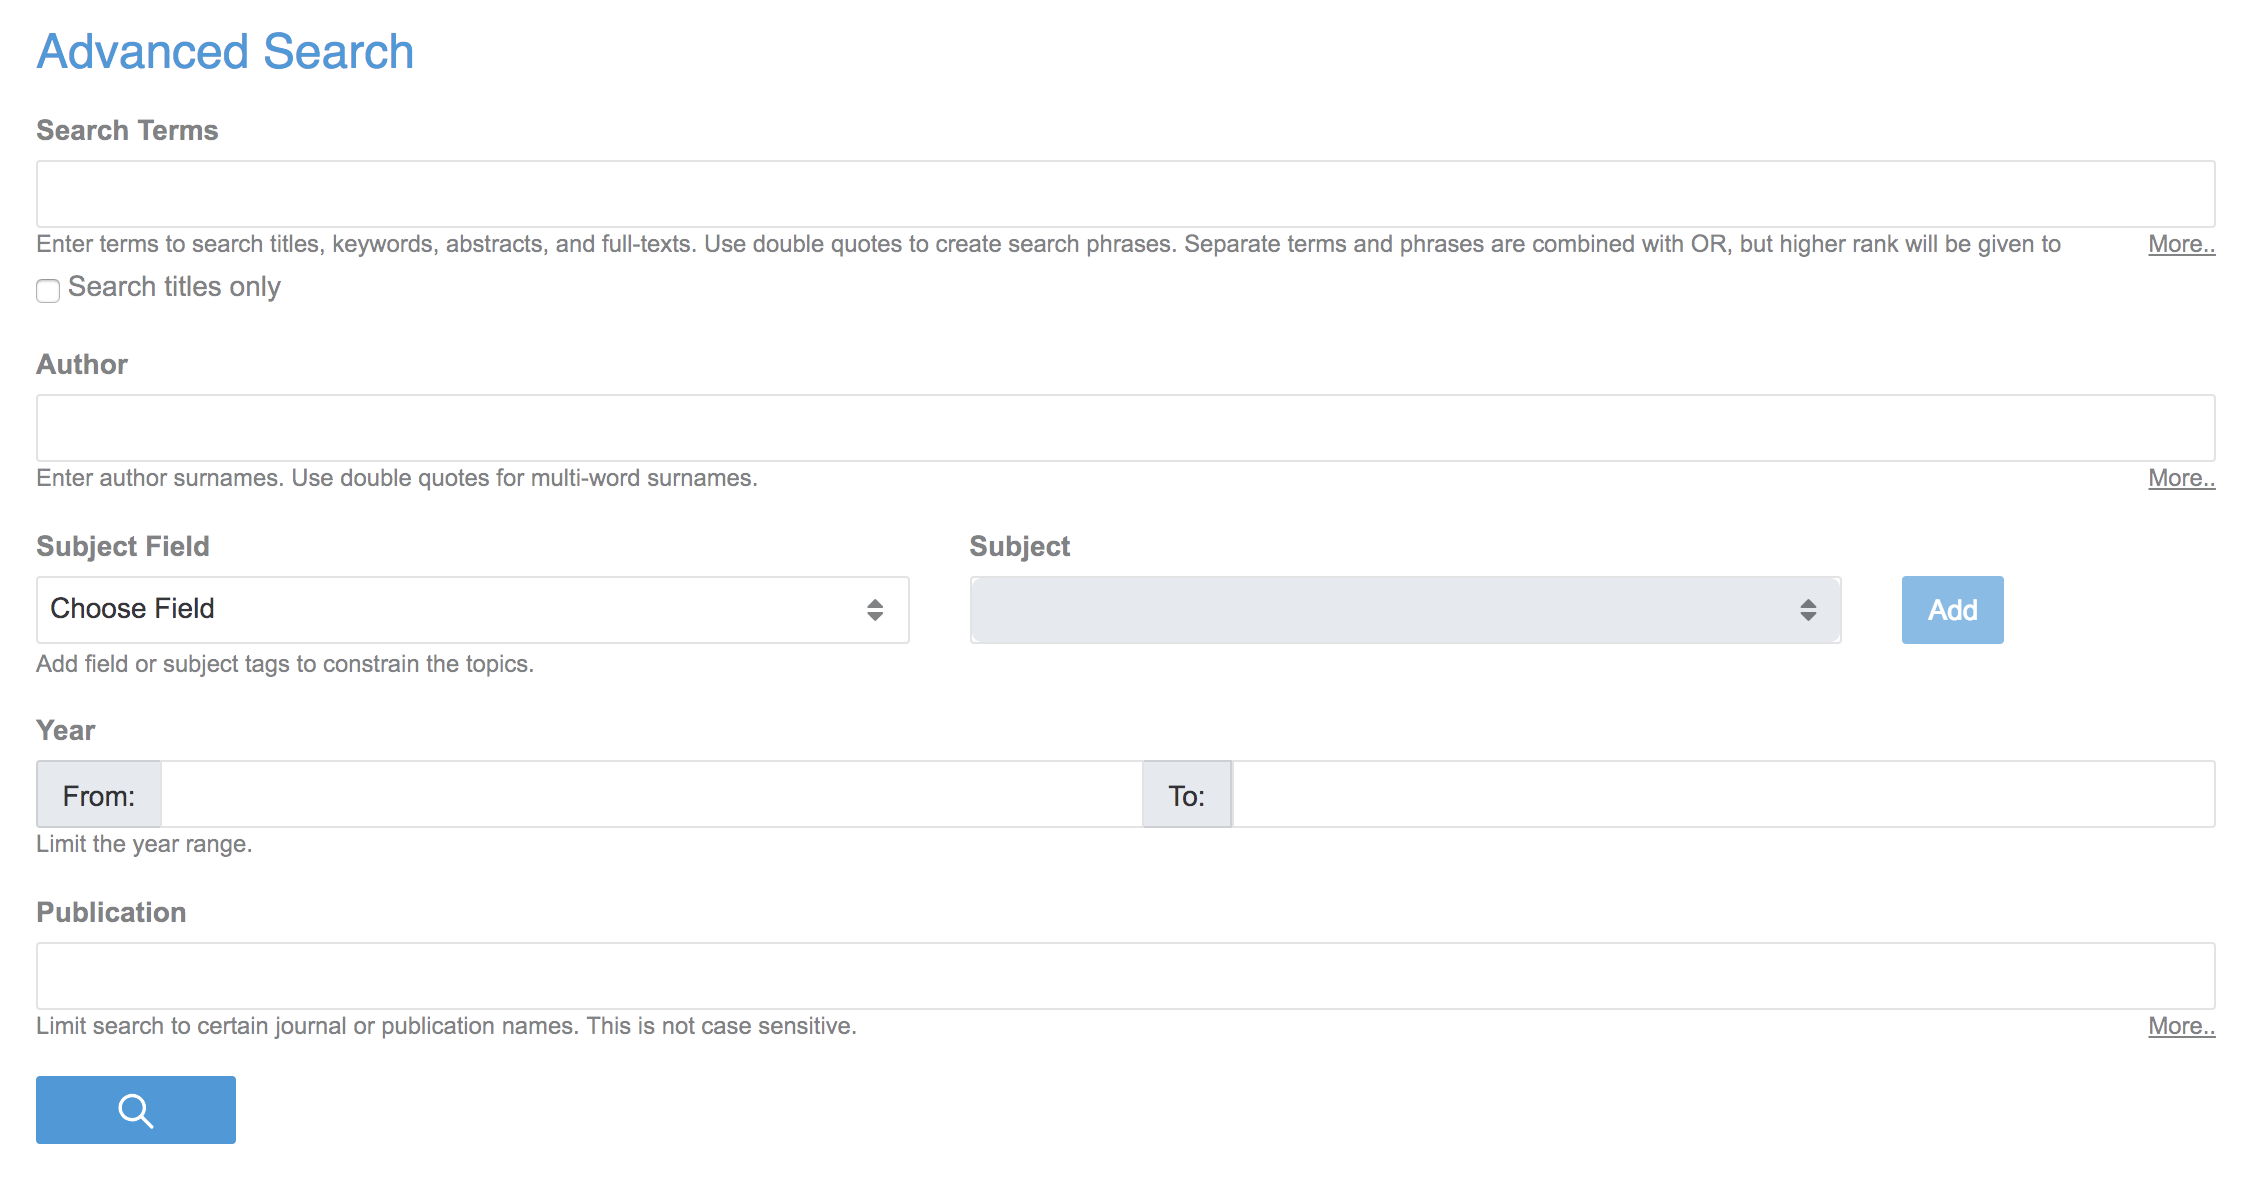
Advanced Search lets you specify fields for your search terms, and constrains the range of articles searched. Access Advanced Search from the button below the main search bar on the homepage.
The Filter tab in the sidebar performs similarly to Advanced Search, but can be applied after a search to filter the results. Filter works with visualizations too, so you can use additonal criteria to filter the articles you see in the interactive charts.
2.5 Summaries
Summaries are 3-point summaries of an article, designed to quickly get the main gist of an article without getting bogged down. You can read summaries by hovering over an article title.
Summaries are computer-generated from abstracts, so only exist for articles for which abstracts are available. We are constantly working to improve the method of generating summaries, however, if you notice one that is poorly formed, please notify us at team@scholarmagic.com.